
Even two models with similar average success rates may yield different results when repeating the same task. Having many tasks solved at least once differs from passing the same task five times in a row. If you miss this distinction when reading tool-using LLM benchmarks, you will find it difficult to understand how successes and failures are distributed just by looking at the numbers in the table.
The author of the bric blog (bric.pe.kr) evaluated four local models running on a single RTX 3090 and two Claude API models by running each 100 BFCL tool-calling tasks five times and scoring them1. As a result, the "average success rate" and the "number of tasks passed all five times" showed different patterns. While qwen3.8 27B had an average success rate of 62.8%, about 4 percentage points lower than Claude Sonnet 5.5 (67.0%), the number of tasks passed all five times differed by 15 tasks: 42 versus 571. This post explains what each metric measures and why they should be considered together through calculations and actual data.
The two metrics aggregate the same 500 runs using different units
The experiment selected 100 even-numbered tasks from the 200 multi-step tasks in the BFCL (Berkeley Function Calling Leaderboard) v4 multi_turn_base, running each model five times per task. Each task involved 1 to 6 sequential user requests. The official BFCL scorer re-executed the functions called by the model and compared the system state and execution results to the ground truth after each user request completed. If there was even one mismatch, the task was considered a failure. Even if the model stated it had completed the task verbally, it would not pass if the state was incorrect. Therefore, this should not be interpreted as an exam where only the final outcome of the entire task matters1.
In this experiment, the total number of runs for a single model is 100 tasks × 5 runs = 500 runs. The two metrics aggregate the logs from these 500 runs based on different criteria.
Average success rate is the number of successful runs divided by 500 out of the 500 total runs. For example, if 314 runs succeeded, the rate is 314 ÷ 500 × 100 = 62.8%. Here, 314 is the number of runs, not the number of unique tasks solved. It is possible for the same task to contribute multiple successes. This metric alone cannot distinguish whether successes are concentrated on specific tasks or spread across many tasks.
Number of tasks passed all five times uses the number of tasks (100) as the denominator, not the number of runs (500). It counts tasks where five consecutive executions all resulted in a pass, excluding tasks that failed even once. In other words, it indicates the number of tasks that remained stable even under repeated execution. Additionally, the author aggregated the "number of tasks passed at least once" and the "number of tasks with mixed success and failure" to further analyze task stability1.
In summary, the average success rate uses the number of runs as the denominator, while the number of tasks passed all five times uses the number of tasks. Although derived from the same logs, these values represent different signals because their aggregation units differ.
Repeated success may vary significantly even if averages are identical
To understand why these two metrics diverge, let’s examine a hypothetical example simpler than the actual data. The following calculations are not measured results from the bric blog but assumptions created solely to explain the difference between the metrics.
Consider a scenario where three tasks are each executed five times, resulting in 15 total runs. The hypothetical model A has success counts of 5, 5, and 0 for each task, while hypothetical model B has 4, 3, and 3.
| Task | Model A Success Count | Model B Success Count |
|---|---|---|
| Task 1 | 5 / 5 | 4 / 5 |
| Task 2 | 5 / 5 | 3 / 5 |
| Task 3 | 0 / 5 | 3 / 5 |
| Total | 10 / 15 | 10 / 15 |
Both models succeeded in 10 out of 15 runs, so their average success rates are identical at approximately 66.7%. However, model A passed all five times on two tasks, while model B passed all five times on zero tasks. In this hypothetical record, model A passed two tasks every time and failed the third task every time. Model B passed every task at least once but also failed on each task at least once. Different distributions exist behind the same totals. This example describes the given 15-run record and does not guarantee success in subsequent runs.
Conversely, if model A showed a pattern of 5/5, 4/5, and 1/5, the average success rate would still be 66.7%, but the number of tasks passed all five times would drop to one. Thus, the count of tasks passed all five times is sensitive to the distribution of successes, whereas the average success rate does not reflect this distribution. While the average shows "how many runs passed," the count of tasks passed all five times shows "how many tasks passed under repetition."
Reading the measured values for Sonnet and qwen together
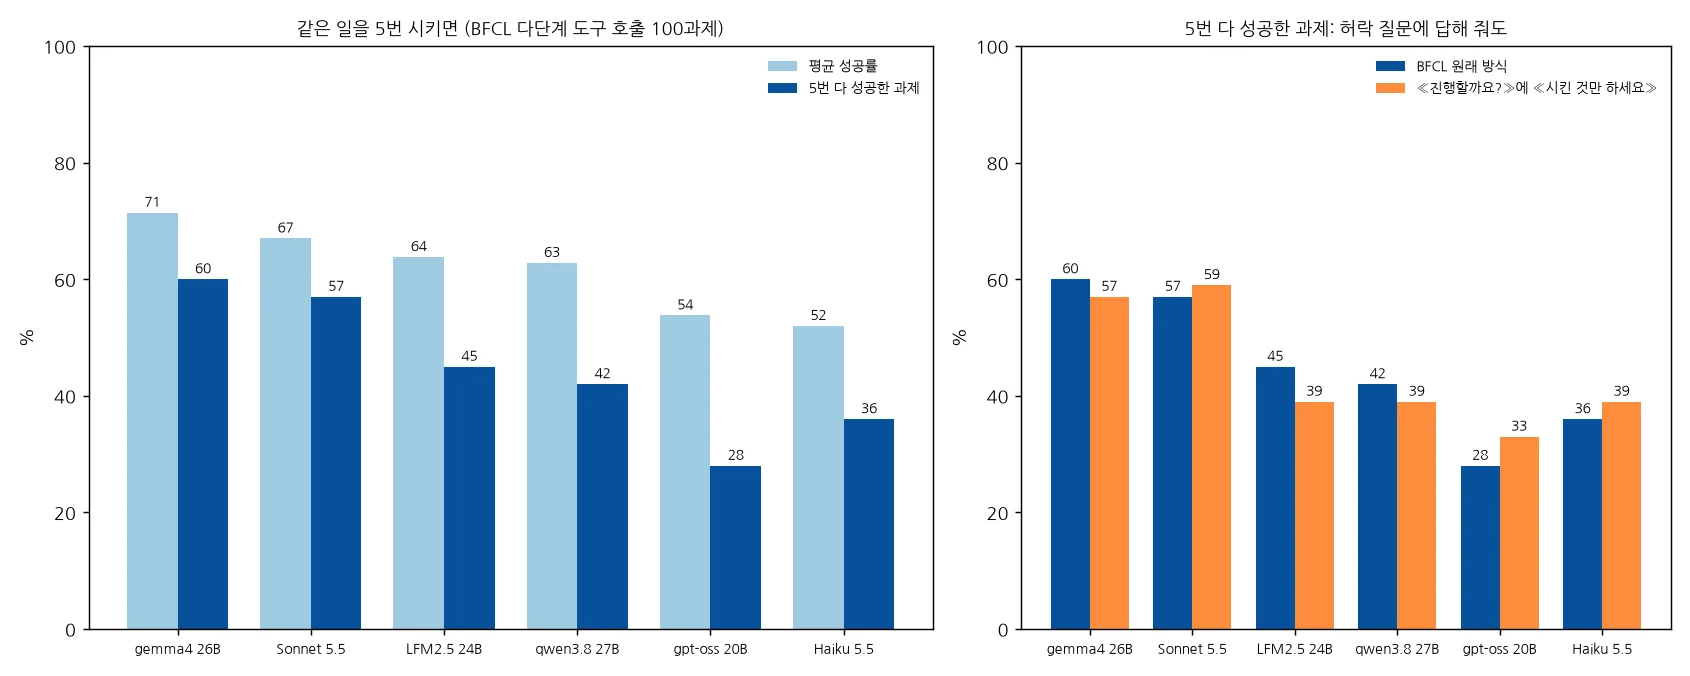
Before interpreting actual measurements, execution conditions must also be distinguished. Local models were run on a single RTX 3090 using Ollama 0.40.13 with a context length of 32k, changing the seed for each repetition. Claude models were executed via the Anthropic API with a temperature of 1.0 and without extended thinking. One should not interpret the seed variation in the local setup as being applied to the Claude API. Also, the LFM2.5 table values in the original text were re-measured with a temperature of 1.0 instead of the default 0.1. Not every row used the default settings for each model1.
| Model | Execution Environment | Avg. Success Rate | Passed at Least Once | Passed All 5 Times | Mixed Success/Failure |
|---|---|---|---|---|---|
| Claude Sonnet 5.5 | API | 67.0% | 76 | 57 | 19 |
| qwen3.8 27B | RTX 3090 Local | 62.8% | 83 | 42 | 41 |
The difference in average success rates between Sonnet and qwen is 4.2 percentage points, while the difference in tasks passed all five times is 15 tasks. Conversely, for tasks passed at least once, qwen had 83, which is more than Sonnet’s 76. Among the six models in the original text, 83 was also the maximum value in this column1. Therefore, in one column, qwen solved more tasks, while in another, Sonnet passed more tasks all five times. Depending on which column you read, the question itself changes.
By subtracting one task count from the other, one can determine the number of tasks with mixed success and failure. For Sonnet, it is 76 - 57 = 19개, and for qwen, it is 83 - 42 = 41개. Conversely, subtracting the number of tasks passed at least once from 100 reveals that 24 tasks for Sonnet and 17 tasks for qwen were never passed during these five runs. All values classify the same 100 tasks. The figure of 83 here represents the observed range of successes and is not an upper limit on all tasks the model can solve.
It is also incorrect to claim that the reliability of an actual service is several times higher by dividing 57 by 42. These numbers count tasks passed all five times in a specific set of 100 tasks. The original text explicitly states limitations: it used English-only tasks of a single type, and repetition was limited to five runs. Increasing repetitions could reduce the number of tasks passed every time1. This table shows results within the measured scope and does not guarantee identical outcomes for different workloads or Korean instructions.
Execution conditions must also be distinguished when interpreting failure records
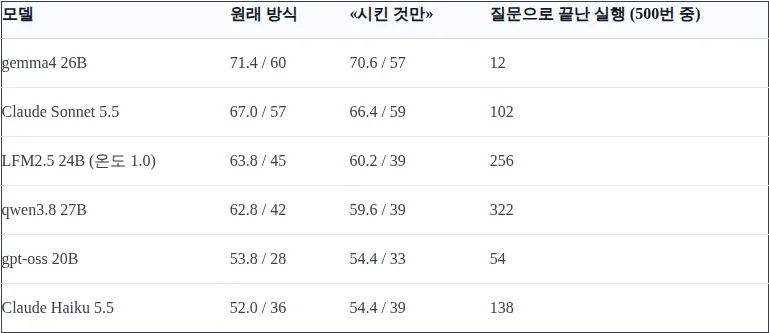
One must distinguish between identifying numerical differences and explaining their causes. Differences in function call order alone do not constitute a failure. This test evaluates system states and execution results verified for each request. Different call paths are acceptable if they reach the same state and results. Conversely, a failure is recorded if the state was incorrect in intermediate requests, even if the final answer appeared natural1.
The original author observed cases where models stopped execution to ask users for confirmation and conducted separate experiments where questions were answered. Initially, simple agreement answers were sent, but it was discovered that this approach also led to agreeing to additional work that had not originally been requested. Measurements were then taken again using user responses instructing the model to do only the requested work. This did not change the model’s system prompt but instead constituted a condition where follow-up user answers were added by the side managing execution1.
The 322 question terminations for qwen mentioned in the original text are aggregated from 500 runs under this follow-up answer condition. They should not be read as additional columns with the same conditions as the initial average of 62.8% and 42 tasks passed all five times. Question detection is a rule looking for specific expressions and includes sentences suggesting other actions. The author explains that the very premise that asking questions penalizes scores is not supported by this data1. This is why one cannot assert that high question frequency is the sole cause of overall success rate differences.
Additionally, the author cites a case where Sonnet created a document with titles and forms not requested by the user, differing from the expected empty file. Although this occurred all five times for that specific task, the author explicitly noted that the overall frequency of such failures was not counted1. Individual records help understand why scoring resulted in a failure, but a single instance cannot be generalized to explain performance differences across all tasks.
The meaning of the evaluation becomes clear when reading the three metrics together
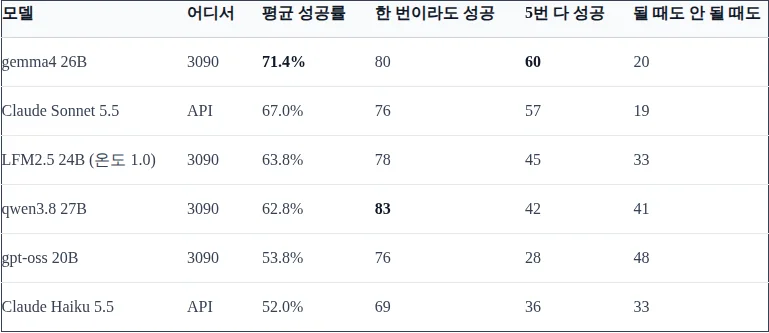
What we should take from this comparison is the order of reading the table rather than slogans selecting a single model. First, confirm that the average success rate reflects the proportion of passes across all runs, then look at the number of tasks passed at least once and the number passed every time side by side. Including the number of tasks with mixed success and failure reveals the distribution obscured by the average alone. It is also incorrect to state that qwen’s 41 mixed tasks is the highest among all models, as the original text includes gpt-oss 20B with 48 such tasks1.
Finally, check which executions are included in the figures. The original text counted errors where local execution tools failed to process responses, as well as Claude API connection errors, as failures1. Therefore, not all aggregated failures can be explained as the model misunderstanding the problem. To clarify the scope of the numbers, one must read not only model names and scores but also execution environments, the presence of follow-up answers, and how errors are counted.
The average success rate aggregates all runs, while the number of tasks passed all five times groups repetition records for the same task. Neither metric replaces the other. If you have read Sonnet’s 67.0% and qwen’s 62.8%, seeing the 57 and 42, as well as the 76 and 83, together is the most accurate way to understand this benchmark. First, distinguish the denominators, then check the distribution of successes, and finally interpret the results within the measured conditions.