
"Is this stock too expensive?"
When you look at a stock chart and the numbers catch your eye, how do you feel? Especially when you encounter a sentence in the news like, "There is a controversy over overvaluation as the PER reaches hundreds of times," your heart might sink.
Today, we will thoroughly dig into the concept of PER (Price-to-Earnings Ratio), the first mountain that every beginner investor must climb. In particular, using the AI company 'Palantir,' which has been a hot topic in the market recently, shall we discover the secret behind why some stocks continue to rise even while recording absurdly high PERs?
PER: What exactly is this indicator telling us?

When you start studying stocks, the first word you encounter is PER. While the term sounds difficult, the principle is surprisingly simple.
PER (Price-to-Earnings Ratio) is, simply put, a figure that indicates "how many times more expensive the stock price is compared to the money this company is currently earning?" The calculation is very straightforward: you just divide the stock price by the Earnings Per Share (EPS).
Shall we look at an example? Imagine you are planning to acquire a local popular Bungeo-ppang (fish-shaped pastry) shop.
- This shop earns exactly 10 million won per year.
- However, the owner says they will sell the shop for 100 million won.
In this case, since you invest 100 million won to earn 10 million won every year, it will take you 10 years to recover your principal, right? This number, '10', is the PER of this shop.
If a company's PER is 1, it means that if the company continues to earn money at its current rate, it can recover its entire investment in just one year. Conversely, if the PER is 1,000, it means it would take a staggering 1,000 years to recover the principal at the current rate of earnings.
Theoretically, a stock with a high PER is an "absurdly expensive (overvalued)" stock, and a stock with a low PER is a "cheaply priced (undervalued)" stock. But is the world really that simple? This is where we encounter the variable called 'growth potential.'
PER of 500x, 1000x? What Palantir's insane stock price proves

Now, let's move into a real-world case. This is the story of Palantir, an AI data analysis company that is currently capturing the attention of investors worldwide as of May 2026.
Recently, Palantir's stock price has been on a relentless upward trajectory. After passing through times when it fell to the $5 range and even earned the bittersweet nickname 'Palantier' (a pun on 'running away quickly' in Korean), it is now breaking all-time highs and continuing its massive rally. But here is the problem: Palantir's PER is fluctuating around a staggering 500x.
Some analyses even offer worried outlooks that the PER might approach 1,000. Compared to giant corporations like Apple, whose PER is usually around 30, Palantir's number is truly 'outside the realm of common sense.' It means you are paying 500 times the money earned in one year for the current stock price.
"So, is Palantir a bubble? Will I be ruined if I buy it now?"
To answer this question, we must understand why Palantir receives such an 'absurd' valuation. The force supporting Palantir's stock price is its overwhelming future growth potential.
- The Brain of the AI Era: Palantir is not just a company that collects data. It has proven its technological prowess by contributing to victories in actual battlefields, such as the Russia-Ukraine war or Middle East conflicts, through data analysis. In an era where AI is moving beyond a mere trend to become an essential tool for industry, their technology is becoming an irreplaceable asset.
- Expansion from Government to Private Sector: While it previously focused on assisting decision-making for massive institutions like governments or the Department of Defense, it is now explosively increasing its client base to private companies in finance, healthcare, manufacturing, and more. As the nature of its revenue changes, the speed at which it earns money is increasing terrifyingly fast.
- Price Reflecting Expectations in Advance: The stock market lives on the 'future,' not the 'present.' Rather than the money Palantir is earning right now, investors calculate the massive profits it will earn 5 or 10 years from now and reflect that in the current stock price. This is why the stock price can continue to rise even if the PER is high.
Of course, there are risks. A stock with a high PER like Palantir can crash terrifyingly the 'moment its growth rate fails to meet expectations.' Because market expectations are set sky-high, there is always the possibility of a sharp drop as profit-taking selling pours in if earnings come out even slightly lower than expected.
How to use indicators to become a smart investor
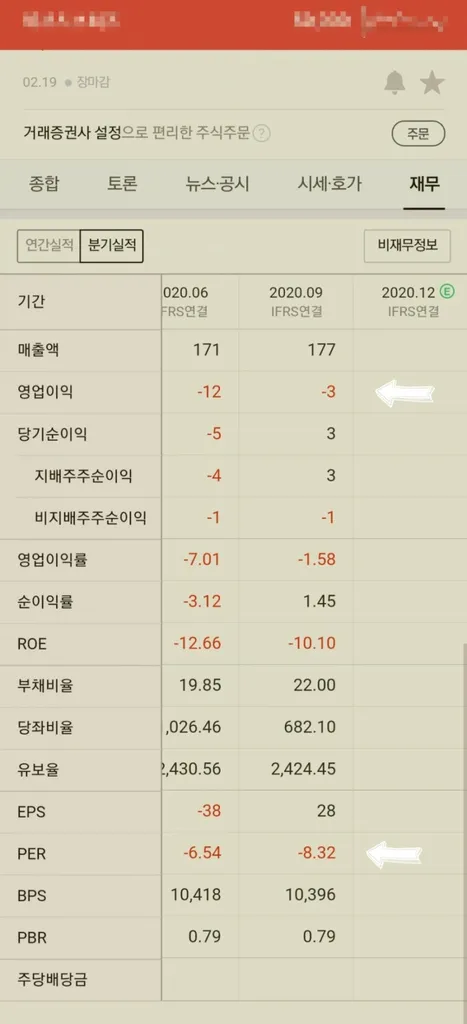
So, how should we utilize PER? Judging simply that "it's cheap because the PER is low" or "it's expensive because the PER is high" is the realm of a beginner. Veteran investors view the indicator in a multi-dimensional way as follows:
First, compare it with the industry average. A PER of 30x for a semiconductor company and a PER of 30x for a banking company mean completely different things. Tech stocks with high growth potential tend to have high PERs by nature. Therefore, it is essential to check at what level the company's PER stands compared to other companies within the same industry.
Second, look at it together with PBR (Price-to-Book Ratio). While PER looks at profitability, PBR (Price-to-Book Ratio) shows how much the stock price is relative to the company's net assets (book value). If the PER is high and the PBR is also excessively high, there is a high probability that the company's ability to generate profit relative to its assets, as well as its asset value, is being overvalued. Conversely, if the PBR is below 1, it means the stock price is cheaper than the company's assets, which can make it an investment with a safety margin.
Third, pay attention to Forward PER. Rather than the money earned up to now (Trailing PER), the Forward PER is calculated based on the money expected to be earned next year or the year after. When analyzing growth stocks, the key is not the current PER, but seeing "how much this high PER can decrease next year (i.e., how much will the profits increase?)"
In conclusion, PER is not an absolute answer, but a 'filtering tool'. It is dangerous to go "all-in" while shouting "This stock is undervalued!" based solely on PER. You should use PER as a primary filter and then comprehensively judge the company's growth potential, industry trends, and the soundness of its financial statements.
Key Summary and Closing

Let's summarize today's content in three lines.
- PER (Price-to-Earnings Ratio) is an indicator that shows how many times the stock price is relative to the company's earnings, representing the period required to recover the principal.
- For stocks like Palantir with PERs reaching hundreds of times, the market price strongly reflects expectations for explosive future growth rather than current earnings.
- Instead of using PER in isolation, you can reduce errors by analyzing it comprehensively along with the industry average, PBR, and expected future earnings (Forward PER).
The stock market is like a living organism. Numbers do not lie, but how you interpret those numbers depends entirely on your insight. Rather than being intimidated by a high PER, I hope you practice reading the 'weight of expectation' contained within that number.
Do you tend to invest in growth stocks with high PERs, or do you prefer undervalued blue-chip stocks with low PERs? Please share your investment philosophy in the comments!
References
- 주식용어정리 사전 - PER PBR 뜻 사용법 공부 : 네이버 블로그 · blog.naver.com
- PER 500이 넘어도 상승하는 주가의 비밀, 팔란티어 · contents.premium.naver.com
- 팔란티어 PER 200배 '고평가' 지적에도 주가는 파죽지세 - Daum · v.daum.net
- PER 뜻과 계산법, 주가수익비율 쉽게 이해하기 - KB캐피탈 · m.kbcapital.co.kr
- 팔란티어(PLTR-US) - 유안타증권 · file.myasset.com