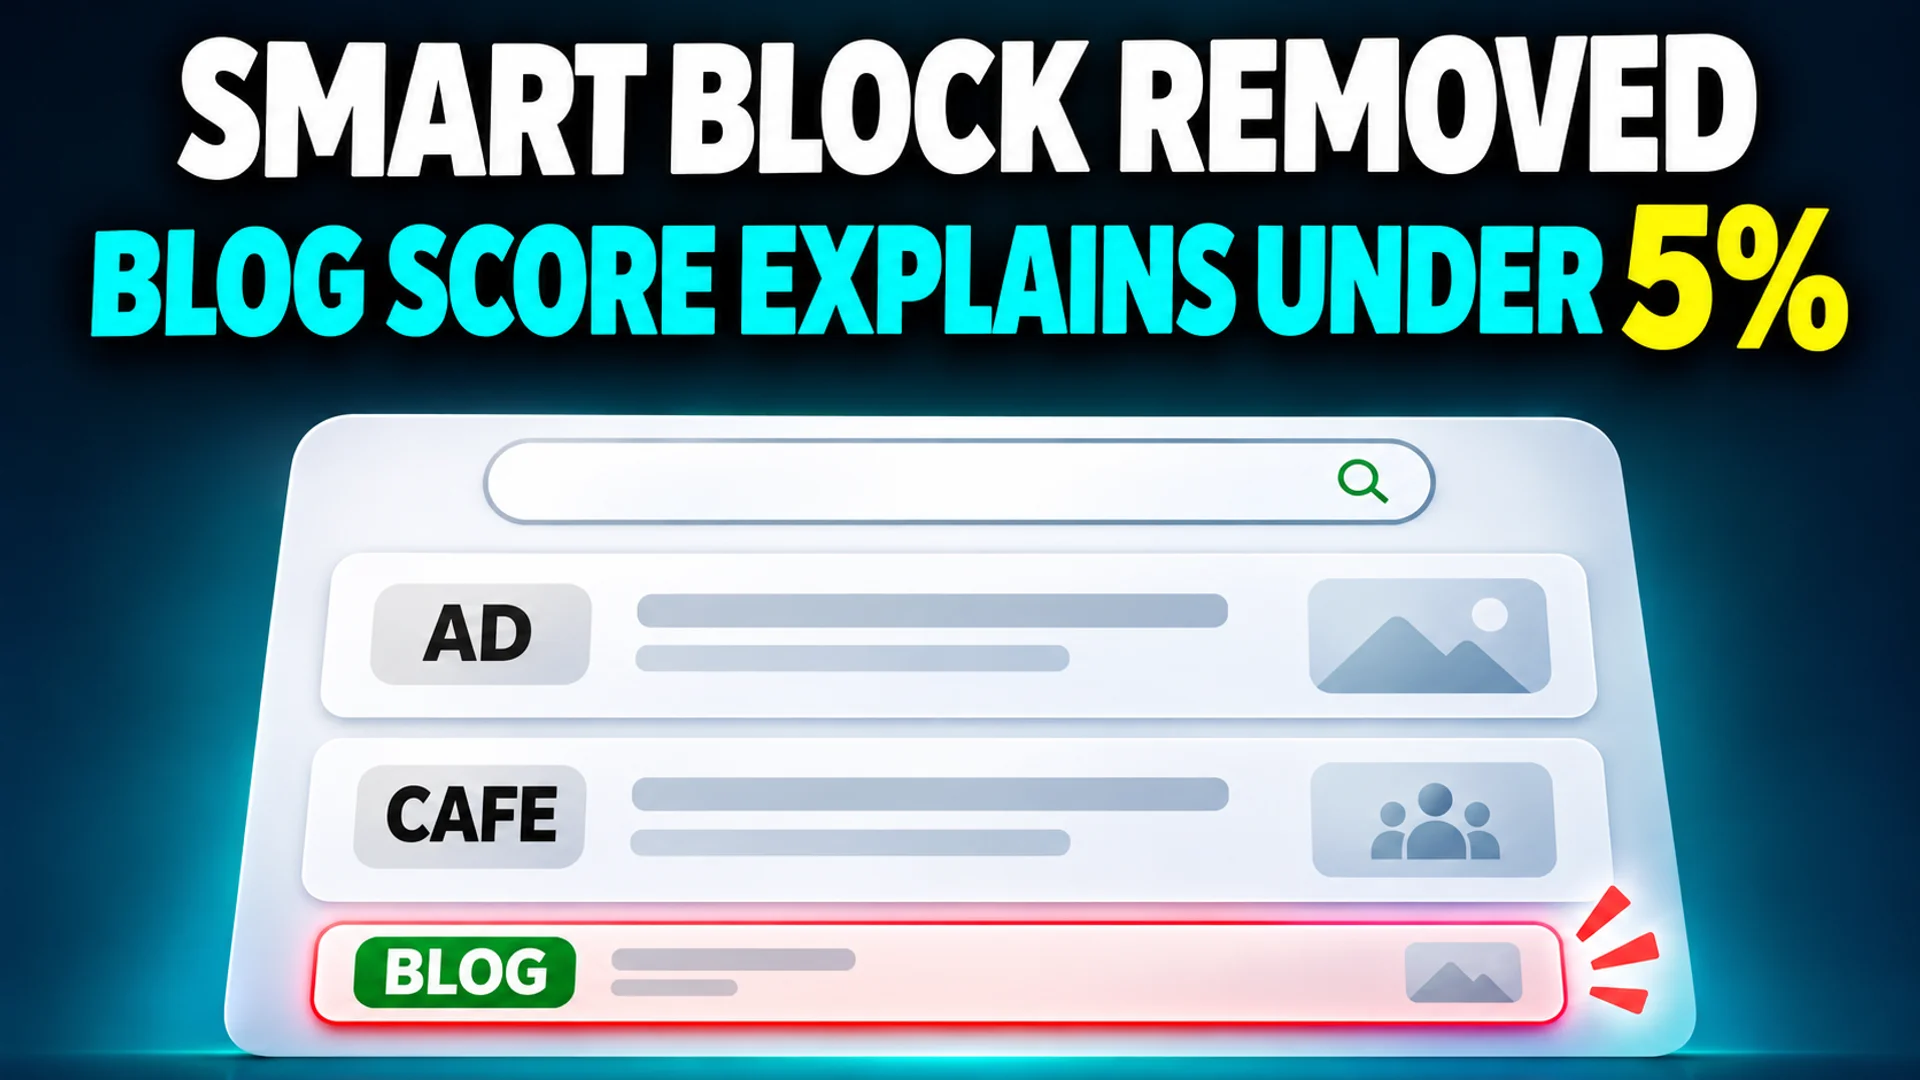
When you type “laptop recommendations” into the Naver app’s search bar, you see three Power Content ads and three café posts at the top of the screen. Only one slot remains available for blog posts. Until recently, the Smart Block system placed several blog slots near the top of results. This structural change occurred without prior notice when Naver transitioned Smart Block to the “popular posts” system in June 20261.
For bloggers who targeted specific, late-stage purchase keywords, this change effectively blocked their revenue path. Amid the disruption of the familiar formula—“include the right search keywords → gain top visibility → receive advertiser inquiries”—some bloggers are verifying the impact of this change with data and publishing the results. This goes beyond sharing individual cases; it represents attempts to identify what actually generates revenue under the changed algorithm1.
The Collapse of Quantitative Metrics: Blog Index Explains Less Than 5%
A blogger operating the YouTube channel ‘When I Wash My Face, It’s Lee Byung-hun’ independently analyzed approximately 2,000 posts that appeared for 200 keywords. The analysis found that existing metrics—such as blog index, character count, number of images, and keyword placement in titles—explained only 4.7% of top-ranking visibility1.
Here, R² (coefficient of determination) is a statistical indicator showing how well the data fit a predictive model. A value of 100 would mean the metric fully explains all rankings, whereas 4.7% suggests that “no matter how much you optimize the blog index or character count, you essentially cannot predict whether your post will reach the first page.” Indeed, the correlation between blog index and ranking was −0.1, indicating that higher blog index does not correlate with higher ranking1.
Two concurrent changes in the Naver ecosystem underlie this phenomenon: one is a change in the ranking logic for search results, and the other is diversification of traffic sources outside the search bar. On September 27, 2024, Naver began rolling out the final version of Home Feed, which recommends content based on users’ subscription, consumption, and search history even when they do not enter a query2.
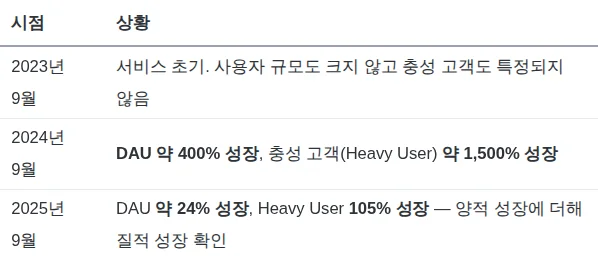
According to data Naver released at its 2024 developer conference (DAN 24), Home Feed’s daily active users (DAU) grew 600% compared to its initial levels, while clicks increased by 800%. At DAN 2025, follow-up metrics showed DAU growth slowing to approximately 24%, but loyal users grew by 105%, confirming both quantitative and qualitative growth3. Home Feed is based on an algorithm (MDE ranker) that predicts not only clicks but also “satisfaction probability (dwell time)”3. Even clickbait titles that generate clicks will fall out of recommendations if users leave quickly3.
What the Data Reveals: New Conditions—“Empathy” and “Situational Description”
In place of collapsed quantitative metrics, correlation with top visibility emerged around “how well the post described the searcher’s specific situation.” In the same analysis, the channel had three AI models score an “empathy index” for 2,000 posts. Posts appearing on the first page of search results had an average empathy score of 74, while posts on page 8 or lower scored 67. The probability that the score difference between the two groups occurred by chance is about 0.003%, suggesting a statistically significant difference1.
This difference is clear in titles when searching for birth gifts. Lower-page posts listed titles like “Birth gift recommendations by price range: 50,000 won and 100,000 won lists.” In contrast, top first-page posts featured titles that brought the searcher’s actual situation to the forefront, such as “What’s a good gift for friend Se-hyun who is pregnant?” or “Birth gift recommendations for a mother whose baby is 100 days old”1.
However, the ‘When I Wash My Face, It’s Lee Byung-hun’ channel itself acknowledged that the empathy index had little effect in categories where precise factual delivery is important, such as recipes or health functional foods. It explicitly noted that empathy is not a universal formula1.
Why Publish Revenue Results?

As it became impossible to predict rankings based on blog index or character count, more bloggers are analyzing and publishing their search visibility rankings alongside their posts’ characteristics. This is less about boasting earnings and more about validating survival strategies in a new environment with data. It reflects attempts to determine whether writing that first surfaces the searcher’s hidden intent actually leads to visibility and revenue, or whether it is just a passing trend.
Ultimately, the reduction of blog slots in “laptop recommendations” search results is not merely a shrinking of slots. It signals that the qualification needed to secure the remaining single slot has shifted from “quantitative SEO score” to “the ability to address the searcher’s specific concerns.” As Home Feed’s recommendation logic incorporates satisfaction probability (dwell time) into its prediction criteria3, and as meaningful correlations between empathy index and visibility rankings have also been observed in the popular posts system, “situational-description posts” appear to hold an advantage over “keyword-list posts.” The author of this analysis noted that the study had been underway for only a few days and that no definitive answer exists yet, cautioning that these findings should not be treated as absolute criteria1. Still, data confirm that the past approach of padding character counts to raise the blog index is no longer a reliable route to revenue. Bloggers’ sharing of revenue results can be understood as a community-level effort to identify new standards that fill the gap left by those outdated metrics.
References
- 스마트블록 끝, 이거 모르면 블로그 수익 다 끊깁니다(2026 인기글 전환, 블로그 지수 시대 끝) · youtube.com↩
- 네이버 홈피드 노출 전략: 검색 외 유입 채널 만들기 · locaposting.com↩
- 네이버 홈피드 노출 극대화 가이드 — 네이버가 직접 공개한 추천 원리로 다시 짠 블로그 전략 · dbhyeong.github.io↩